

Schedule a talk with one of our advisors to learn more about Summitry and how we can help you get a foothold on your financial life. For career opportunities please visit careers at Summitry.
Team
Insights
Pages
- Let's Talk
- Phone / Directions
Sustainable Income

Sustainable Income Strategy
March 31, 2026
During an uncertain market environment in Q1 2026, the Sustainable Income Strategy (along with its all-equity cousin, the Dividend Growth Strategy) offered some measure of stability. Companies that reliably distribute earnings to their owners in the form of a dividend are often seen as safe havens during periods when investors reassess their willingness to take risks over an uncertain future. We believe this behavioral tendency influenced results in the period. As a point of comparison, the S&P 500 Dividend Aristocrats Index, so named because the index is comprised of companies that have consistently increased their dividend payments for at least 25 consecutive years, produced a gain in the quarter of +2.4%, far outstripping the loss for the S&P 500 Index of -4.3%.
Over the long term, the broad market has outperformed the Aristocrats, with the S&P 500 producing a 10-year annualized return of +14.7% as compared to an annualized return for the Aristocrats of +10.0%. We think that investors should expect a continuation of this outperformance over full market cycles, since the most dynamic and fastest growing companies in the economy generally do not have the long track records of dividend payments what would qualify them for the Dividend Aristocrats index. The purpose, therefore, of having exposure to a dividend-focused portfolio is different:
- The Aristocrats have historically exhibited an average of roughly 80% of the volatility, measured by standard deviation of returns, of the S&P 500 Index (as was clearly exhibited in the recent quarter). That gap has widened historically during tech-driven selloffs. Investors who value stability of results may opt for a dividend strategy for some or all of their capital.
Anthropic Claude analysis: Data sources: ProShares Dividend Aristocrats ETF (NOBL) as proxy for S&P 500 Dividend Aristocrats; Yahoo! Finance
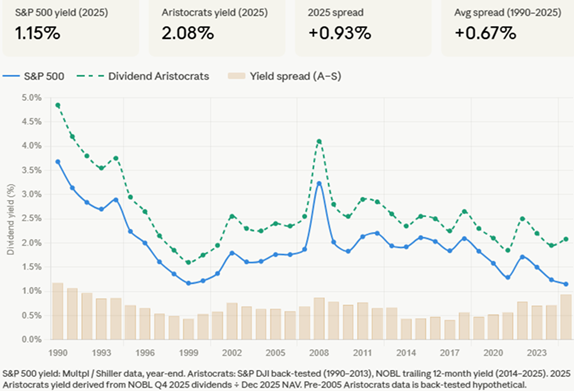
- The Aristocrats produce more income for investors through their dividends than the broad market. This is valuable for investors who draw income from their accounts to cover life’s expenses. The yield differential at year-end 2025 was roughly 93 basis points (see below). Note, however, the below comparison does not reflect the full income story. The Aristocrats’ dividend growth rate (historically ~6-8% per year) means the “yield-on-cost” for a long-term investor will compound significantly over time, well beyond what the current yield comparison shows.
Anthropic Claude analysis: Data sources: ProShares Dividend Aristocrats ETF (NOBL) as proxy for S&P 500 Dividend Aristocrats; Multpl / Shiller
The relatively strong performance of Sustainable Income was less due to Summitry’s actions than to the characteristics described above. Summitry underperformed its benchmark. A composite of accounts invested in the Sustainable Income Strategy generated returns of -0.6% and -0.9%, gross (before) and net (after) fees, during the first quarter. The Sustainable Income Composite’s longer-term results are more respectable (please see performance disclosure at end of this note)
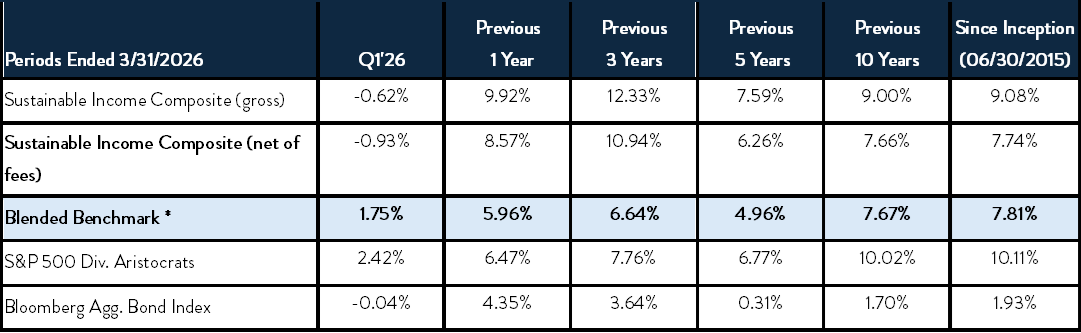
*Blended Benchmark: 70% S&P 500 Dividend Aristocrats/30% Bloomberg Aggregate Bond Index
Individual client account performance varied around this composite average, reflecting their specific mix of stocks, bonds, preferred stocks, and bond ETFs. As always, we remind you that returns from this strategy and performance relative to our benchmark will ebb and flow over time, as do the stock and bond markets in which this strategy invests.
Dividend Growth
Eight companies in the Sustainable Income portfolio increased their dividend in Q1, including: BAM (+14.6%), CARR (+6.7%), CSCO (+2.4%), ETN (+5.8%), KMB (+1.6%), MMM (+6.8%), SCHW (+18.5%), TSM (+14.5%). RTO is also planning a +3% increase for FY 2026. Note that most of these increases are well ahead of the current level of inflation, meaning that the purchasing power of this income stream is growing in real terms. This is precisely the objective of the Sustainable Income strategy. No companies in the portfolio decreased their dividends this quarter.
Of the many factors that we consider when selecting companies to own in the Sustainable Income portfolio, the capacity and commitment to pay sustainable and growing dividends are among the most important. The capacity to pay growing dividends is derived from earnings growth and strong balance sheets. The commitment comes from various company managements and boards of directors who choose to share surplus earnings with shareholders. Not every great company will pass through earnings in the form of a dividend, which is a reasonable choice if the earnings can be reinvested in the business in initiatives that promise high returns on investment. Those stocks will not qualify for the Sustainable Income strategy, but they may be held in other strategies managed by Summitry. But when a management team cannot redeploy cash in a manner that will generate a high return within the company’s operations, we would prefer they remit that cash to shareholders in the form of a dividend. These are ideal stocks for Summitry’s Sustainable Income portfolio strategy.
Q1 ’26 Top Contributors
- Verizon (VZ) returned +25.5% in the quarter. We believe VZ is back on their feet after several quarters of lagging AT&T and T-Mobile in subscriber growth. VZ delivered 616K of net postpaid phone subscriber growth in Q4, the largest number in years. They expect to deliver another 750K to 1M in net postpaid subscriber growth in 2026, which is in-line with its peers, suggesting their promotional efforts to entice customers is working.
- Caterpillar (CAT) returned +25.1% in the quarter. CAT continued its phenomenal run as it delivered 18% growth in sales in Q4, driven by robust growth all around but particularly in Power & Energy. Power generation grew 44%, driven by strong demand for generators and turbines used in data centers. Management expects to deliver close to 7% sales growth in 2026, led by Power & Energy.
- Johnson and Johnson (JNJ) returned +19.1% in the quarter. JNJ saw an acceleration in sales growth throughout 2025, delivering 6% organic growth in Q4. Innovative Medicine grew 6% organically in Q4, despite a nearly 50% decline in Stelara due to patent expiration. JNJ has successfully navigated through the Stelara patent cliff, which was a major overhang on the stock prior to 2025, and has provided strong guidance for ~6% organic sales growth and 7% EPS growth for 2026.
Q1 ’26 Top Detractors
- Microsoft (MSFT) returned -23.3% in the quarter. MSFT was caught in a broader de-risking of high-valuation technology stocks as interest rate uncertainty resurfaced alongside the Iran conflict. The market is currently scrutinizing both the massive capital investments required for AI and concerns about how generative AI might disrupt Microsoft Office’s traditional per-seat SaaS model. However, we remain optimistic for several reasons. AI adoption continues its rapid pace, with paid Microsoft Office Copilot seats growing +160% year-over-year to 15mm in January 2026. Meanwhile, Microsoft’s Azure cloud infrastructure business continues to grow at a robust 35%+ rate, effectively capturing the compute spend that fuels the AI revolution.
- Universal Music Group (UNVGY) returned -26.3% in the quarter. The company faced continued pressure as the market worked through the technical overhang of the Bolloré interest. While the company initiated its first-ever share buyback program in late March to signal confidence, investors remain cautious regarding the potential for large-scale share sales by minority stakeholders. We maintain our view that these dynamics are separate from UMG’s fundamental ability to grow revenue through music subscriber growth and its renegotiated distribution agreements. We note that several days after the quarter’s end, a large UMG shareholder, Bill Ackman’s Pershing Square, formally proposed a comprehensive plan to unlock value in the company’s shares, which lead to the recovery of a substantial portion of the first quarter’s declines in share price.
- Louis Vuitton Moet Hennessey (LVMUY) returned -27.6% in the quarter. The company continues to suffer from weak sales following the pandemic-era demand surge. Consumer weakness and tariff-related uncertainty are additional headwinds. The war in Iran is causing further investor nervousness as the Middle East region, although a small percentage of sales, was a bright spot for LVMH. We believe the negative impacts from the Iran conflict should not have lasting effects on the business. We maintain our view that sales growth should re-accelerate with new product innovations and brand investments the company is making. In the meantime, CEO and Chairman Bernard Arnault, continues to signify his confidence as he has purchased 650mm EUR worth of LVMH shares through his personal wealth since the start of this year.
Fixed Income Securities
The Sustainable Income portfolio has traditionally held approximately 30% of its assets in bonds and similar securities that offer a fixed yield. Their primary purpose is to increase the overall portfolio yield rather than offer long-term appreciation potential. Bond markets started the year in positive territory, but markets were rattled by Middle East uncertainty, sending rates higher and prices lower. By quarter end, most of those losses were recovered, and bonds delivered on their typical promise of stable cash flows and relatively stable valuations.
Key Actions
During the quarter, the portfolio management team left unchanged its model portfolio for Sustainable Income. Clients may have seen some activity as traders rebalanced portfolios to align them with this model. The lack of change reflects the management team’s confidence in the portfolio as constituted to weather continued market uncertainty, deliver a growing stream of dividends and participate in equity market appreciation over time. The team is always surveying existing and potential new holdings and will make changes to the model as warranted.
Conclusion
The Sustainable Income strategy has produced respectable returns in volatile markets and over a market cycle. We believe Sustainable Income remains a good choice for clients who seek growth of income over time and reduced portfolio volatility, while retaining some opportunity for capital appreciation.
About Summitry’s Sustainable Income Strategy
Many clients ask us to address the tradeoff between their need for current income and desire for capital growth. Bonds alone are unlikely to generate sufficient returns to preserve purchasing power over the long-term, but stocks subject the investor to greater volatility. The power of long-term compounding of wealth provided by the equity markets can be lost if volatility compels clients to liquidate securities during market drawdowns. This concern typically grows more acute as clients age and time horizons compress.
To meet this challenge, we devised a portfolio strategy in 2015 that attempts to balance the need for reduced volatility with a desire for capital appreciation. Our solution is a diversified portfolio primarily consisting of blue-chip companies that pay regular and growing dividends out of surplus cash flow. We believe these companies generate earnings beyond what is needed to grow their businesses. This surplus allows management to raise their dividend payouts over time. We call this our Sustainable Income strategy. To learn more, we gave a behind-the-scenes look at our Sustainable Income strategy here.
Summitry’s Dividend Growth Strategy
Summitry’s Dividend Growth Strategy is comprised 100% of dividend-paying equities and is made available to clients who wish to have exposure to the income generation and total return opportunity that is offered from the equities held in the Sustainable Income strategy, but without the exposure to SI’s bond and preferred stock holdings. Your Financial Advisor can help you decide if this is a useful and appropriate strategy given your personal financial circumstances.
This commentary reflects the opinions of Summitry, LLC and is for informational purposes only. Nothing herein constitutes investment advice or any recommendation that any particular security, transaction, or strategy is suitable for any specific person. The securities identified do not represent all the securities purchased, sold, or recommended for client accounts. Past performance does not guarantee future returns. Investing involves risk. The reader should not assume that an investment in the securities identified was or will be profitable. An index is a hypothetical portfolio of securities representing a particular market or market segment and is used as an indicator of the change in the securities market. Indexes are unmanaged, do not incur fees and expenses, and cannot be invested in directly. For Top Contributors and Top Detractors, the investment characteristics presented are shown on a gross basis and do not reflect the deduction of advisory fees, trading costs, custodial fees, or other costs that clients have paid or would have paid. The deduction of fees and expenses reduces investment returns and would also affect the investment characteristics presented. The criteria used to select the presented investments are based on the top contributors to performance for the period and top detractors to performance for the period. Other investments held during the same period may have performed differently, including experiencing losses. For a complete list of holdings during the period discussed, please contact your Advisor.
