Schedule a talk with one of our advisors to learn more about Summitry and how we can help you get a foothold on your financial life.
Team
Insights
Pages
- Let's Talk
- Phone / Directions
Perspective on a Strong Year for Returns
Jan 23, 2020

Q4 2019 Quarterly Commentary – January 1, 2020
As we enter the New Year, investors have much to celebrate. U.S. stock markets logged their best results since 2013, and global markets generally followed suit. The S&P 500, with dividends, produced a return for the year of 31.5%; the Dow Jones Industrials returned 25.3%; and the tech-heavy NASDAQ Composite returned 36.7%. U.S. corporate, Treasury and municipal markets posted their best results since 2002. The Barclay’s Aggregate Bond Index returned 8.7% during the calendar year, driven by declining interest rates. These strong returns across financial assets were accomplished despite a continuation of the trade dispute with China, impeachment proceedings involving a sitting President for only the third time in our country’s history, increasing political polarization in the U.S. and abroad, increasing tensions with Iran, slowing manufacturing trends, and many other factors that could understandably have led investors to seek shelter rather than participate. And yet, markets advanced.
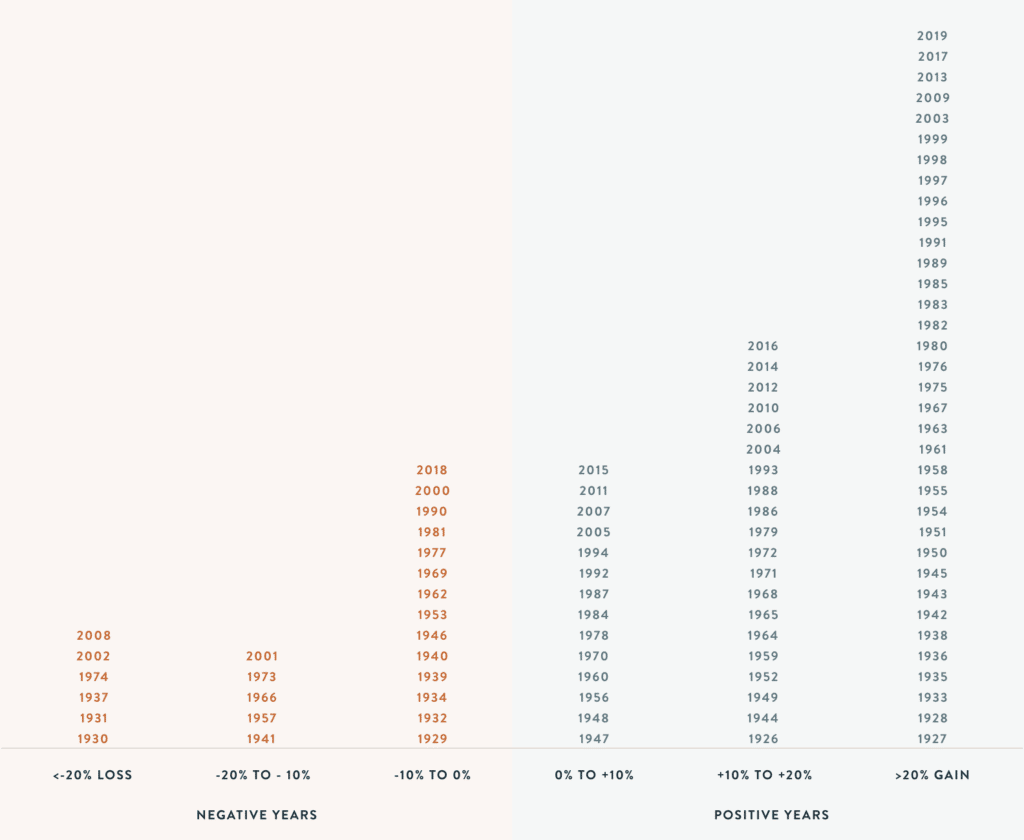
First, it should be noted that the strong return generated by this year’s stock market isn’t a rare occurrence. The table below provides long-term perspective on stock market returns since 1926. The columns on the far left, in red, represent very difficult years in the stock market, when equities declined by over 20%. As you move toward the center, the losses are smaller, and as you move right of center, the table presents increasingly positive years for investors in equities. Any statisticians reading this note will recognize that this distribution is not a normal, bell-shaped one. It is highly skewed toward years with stock market returns in excess of 20%. The returns we experienced in 2019 are anything but rare. In fact, they’re common.

Source: Strategas Research Partners
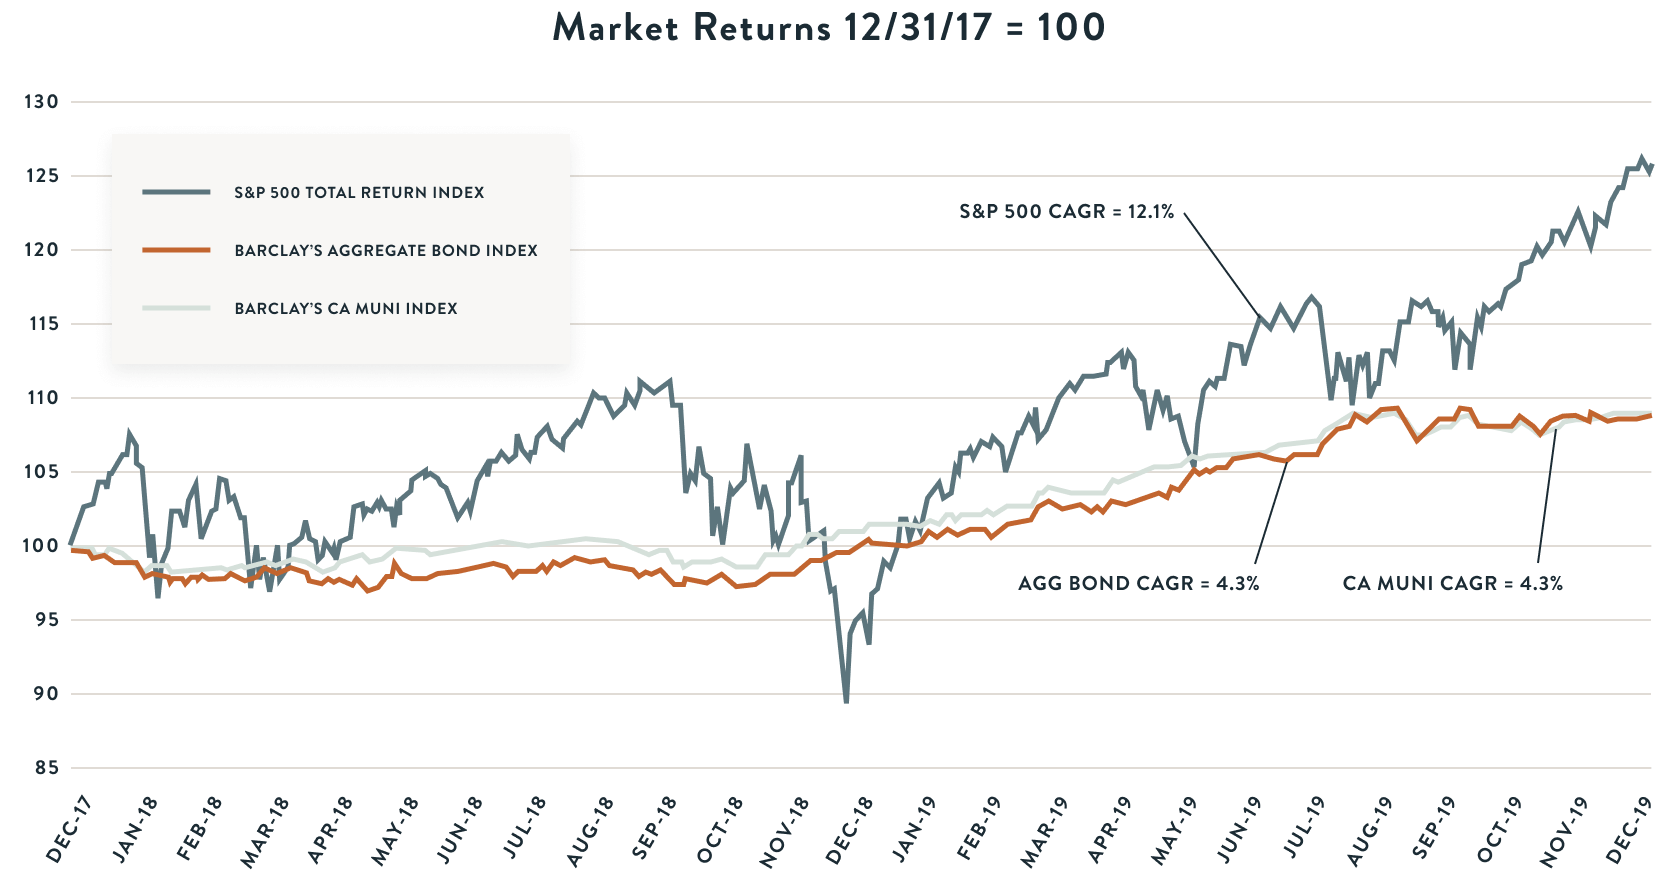
More importantly, we should not get fixated on returns during any one calendar year, particularly if our investment time-horizon is long, as it is—we feel safe to say—for every client we serve. The table below shows returns for the two-year period beginning January 1, 2018 and ending December 31, 2019. The period saw an annualized rate of return of 12.1% for the S&P 500, including dividends, 4.3% for the Barclay’s Aggregate Bond Index, and 4.3% for the Barclays California Muni Index. These are far closer to the norm we might expect over the long term. Time for investors does not start and stop on January 1st of any particular year. It runs from now, to retirement and beyond.

Source: Bloomberg
It is worth noting the deep “V-shaped” decline in the two-year stock chart above. It’s a reminder that markets are volatile, and the path to a 12% annualized stock market return during this period was anything but smooth.
So what of the future? We wish we had a crystal ball for the markets, but in its absence we focus on the two things that matter most when building portfolios and building wealth: fundamentals and valuation.
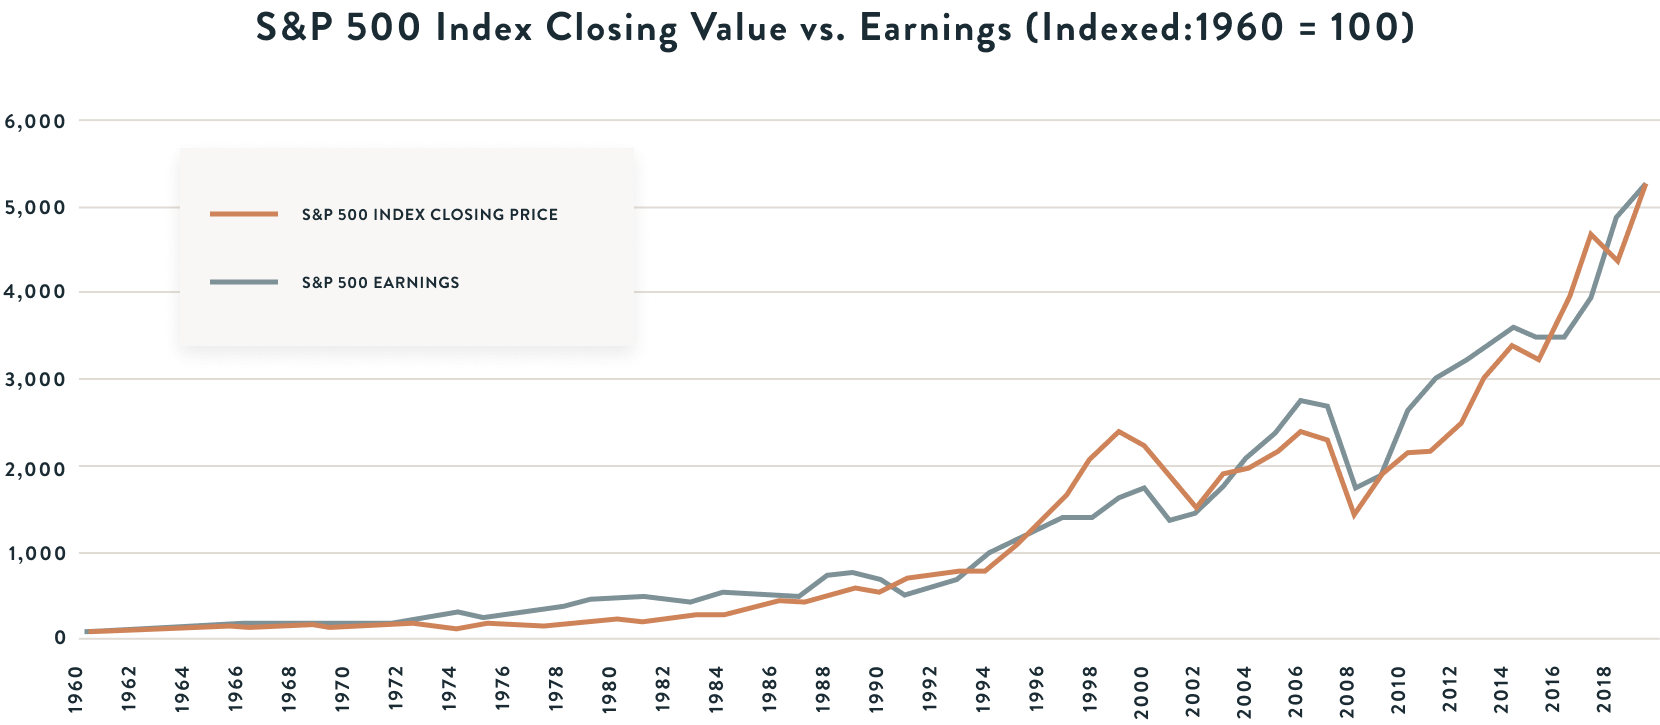
Fundamentals: The chart below delivers a powerful message that fundamentals matter—a lot. The blue line shows the value of the S&P 500 index since 1960. The red line shows the level of earnings generated by S&P 500 companies. Statisticians will note that the correlation of these two lines is extremely high (~0.97). Earnings are clearly an important reflection of business fundamentals. If we can build confidence around the direction and pace of earnings growth, we will have done ourselves a service as investors. When we purchase stocks, we therefore focus a great deal of attention on projecting the underlying business’s earnings several years into the future.

Source: Bloomberg
This is nevertheless a simplistic view of business fundamentals. When we look at businesses and project earnings, we consider a multitude of factors, like balance sheet strength, competitive position, cyclicality, the evolving macro and micro-economic environment, etc.
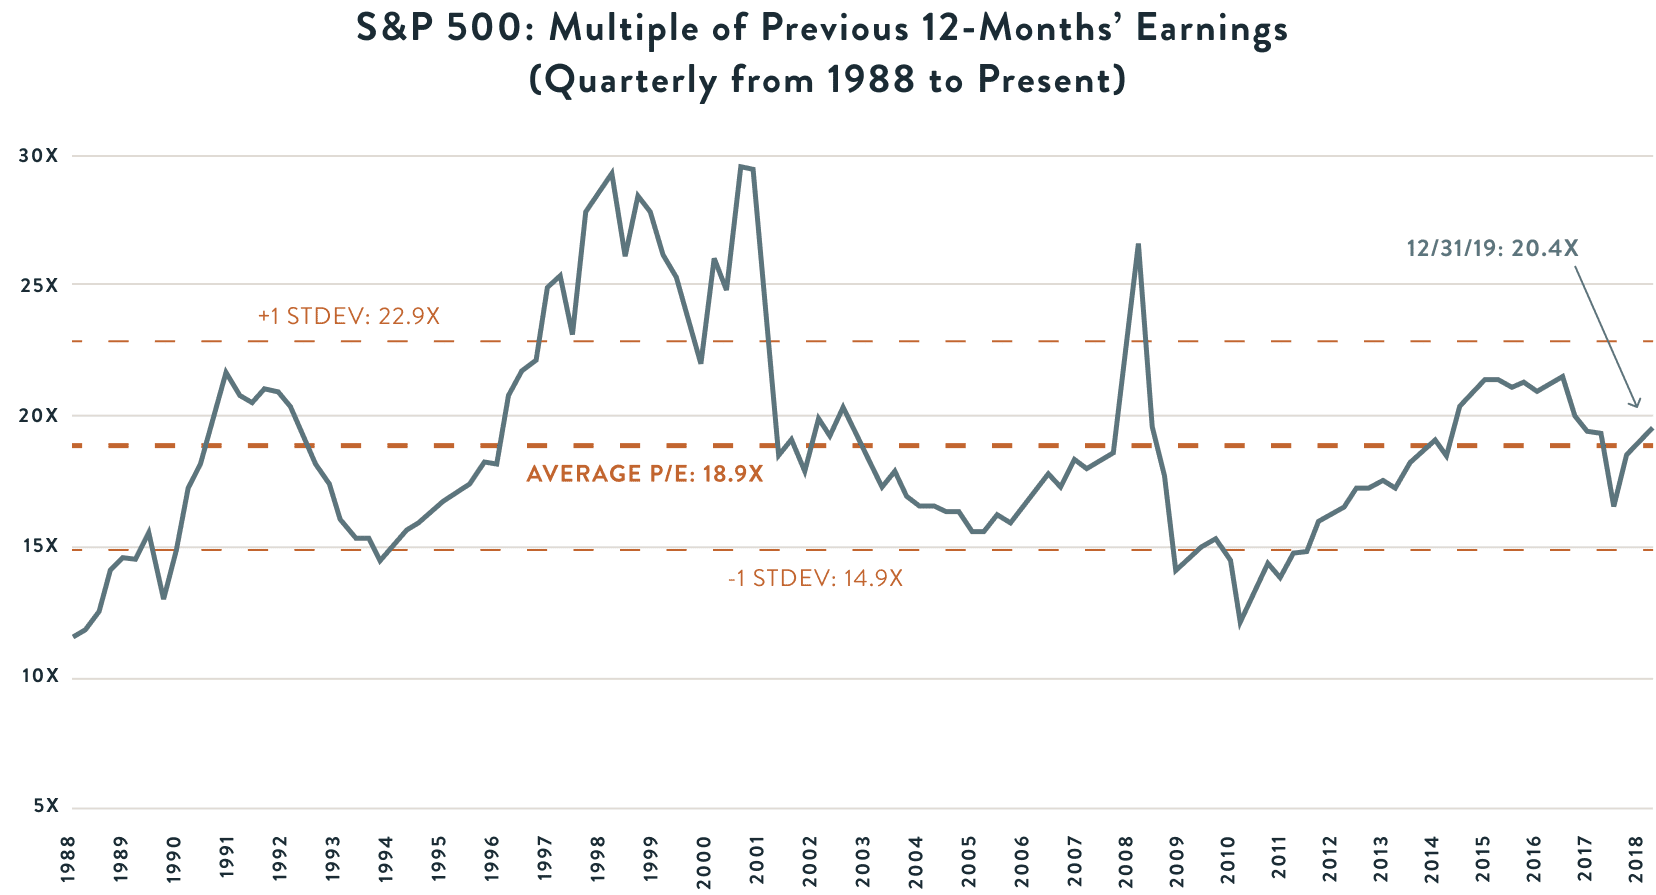
Valuation: The second important factor is valuation. The chart below provides one common measure of total-stock-market valuation, the P/E ratio. It answers the question, what price does the market pay for the earnings generated by the companies that make up the market? And how does that price compare with the past? As you can see, there is variability in this measure over time. Today, the market trades at roughly 20x the earnings that were produced by S&P 500 companies over the previous 12 months. This is slightly above average when compared to the period beginning in 1988, as shown in the chart. We view the market on average as neither expensive nor cheap. But the S&P 500 is an index made up of 500 constituent companies. Some represent better bargains than others. Our job, in a nutshell, is to find businesses with strong fundamentals that are available at bargain prices.

Source: Standard & Poor’s; Bloomberg
Investing is an inexact science, but having a time-tested discipline focused on fundamentals and valuation should help a lot to improve the consistency of returns. It allows us to spend less time guessing about whether or by how much the market will react to factors that have limited influence on business fundamentals. We don’t need to know if the Republicans or Democrats will control Congress and the White House next November to make a decision about whether a business is well positioned competitively or its stock is cheap or expensive, and we don’t have to guess whether the storming of an embassy in Baghdad and heightened military tensions will impact the market, because we are invested in businesses that are durable.
Q4 Portfolio Changes
Please keep in mind, these commentaries should not be construed as a recommendation to buy or sell the securities discussed. Such decisions are made only within the context of the market environment as we perceive it at the time of the decisions and the structure of the diversified portfolio of which the securities are a component. ***
During the quarter we did not initiate any new positions but exited our positions in Bank of New York Mellon, LabCorp, Owens Illinois, and John Deere.
Bank of New York Mellon
Bank of New York Mellon (BNY Mellon) is the world’s largest custodian and a prominent investment manager, primarily for institutional investors. When we bought the stock, we assumed that BNY Mellon would benefit from the growth in financial assets globally. We also thought that rising interest rates would allow BNY Mellon to earn higher returns on customer cash balances, driving revenue and earnings higher.
Despite high market share and limited competition, BNY Mellon has been a perennial underperformer, as customer consolidation hurt pricing power and pressured margins beyond management’s ability to cut costs. Our hope was that the hiring of Charlie Scharf as CEO, a couple of years ago, would instigate a change in direction that would result in operational improvements. Scharf introduced a plan to drive higher growth and margins by adopting more technology and automation, a plan that should have been sufficient to turn the ship around.
Unfortunately, Scharf resigned earlier this year to become the CEO of Wells Fargo, leaving a big hole at BNY Mellon. Scharf’s replacement as CEO is a 30-year company veteran, which calls into question whether he will be able to drive the changes necessary to improve growth and margins. Since there is no indication the new CEO is open to unlocking value by splitting the custody and asset management businesses into separate companies, we decided that the best course of action was to exit the position.
LabCorp
LabCorp is one of the two largest medical diagnostic lab companies in the United States. The company also owns Covance, a major provider of contract research services to pharmaceutical and biotech companies. LabCorp’s main competitive advantages include efficient scale as well as being the low-cost operator in a fragmented industry.
Our thesis in LabCorp was founded on the belief that the diagnostics business would stand to benefit from industry consolidation trends as a best-in-class operator. In addition, we believed that Covance can benefit from solid organic growth over the long term driven by increased demand from its customers and synergies with the diagnostics business. Crucial to our thesis was our belief in the seasoned management team that had a strong track record in operating the business and allocating capital.
While parts of our thesis played out as expected, we recently became concerned by an unusually high management turnover, which included the retirement of the company’s CEO and three changes to the head of the diagnostics business just in the past 12 months. With the stock trading near our fair value estimate, we decided the risks holding on to LabCorp outweigh the benefits so we sold out of the position.
Owens Illinois
Owens-Illinois is the world’s largest manufacturer of glass containers and benefits from a dominant market position in the Americas and Europe. The company has strong competitive advantages that stem from its scale, very high customer switching costs, and sizable barriers to entry. When we made the investment, we expected revenue to grow at a low single digit rate but earnings to grow much faster on the back of operational improvements and margin expansion.
To our dismay, key elements of our thesis were proven wrong. First, management failed to execute on its cost improvement plan and what was described as “one-time” hiccups turned out to be more recurring in nature. More important, recent disclosures from the company as well as additional research work by our team led us to conclude that demand for O-I’s products was actually declining, and the likelihood of a rebound any time soon was not high. We consequently concluded that our thesis was broken and decided to exit the position.
Deere & Company
Deere is a leading global provider of agriculture and construction equipment. The agriculture machinery market is an oligopoly and Deere is the most dominant player in all geographies, especially North America, where it has over 50% market share.
Deere benefits from benign competitive dynamics that enables it to generate good returns on invested capital. The company is very well managed, with management having a terrific track record making very smart capital allocation decisions and exhibiting operational acumen that has optimized the business. Strong management has been a fundamental reason why Deere has consistently stayed ahead of its competitors.
Despite Deere’s strong competitive advantages, selling equipment to farmers is a cyclical business. When we first initiated the position, Deere was facing a severe market downturn, which resulted in sharp drops in revenue and profits. Our investment thesis was that the cyclical decline was temporary in nature, and that eventually end markets would recover, which would lead to a recovery in revenue and profits. Most importantly, when we initiated the position, we thought that the stock was extremely cheap, and that the price did not reflect the full earnings power of the business.
Since we initiated the positon, it took two and a half years before Deere’s end markets bottomed and almost five years before they fully recovered. But patience when investing often produces rewards, and Deere is a case in point. The recovery in Deere’s end markets led to growth in revenue and earnings, which resulted in the stock doubling in price over our holding period. Since our investment thesis has played out in full, and the stock does not currently offer any margin of safety, we decided to exit the position.
New to the Team
We are pleased to announce the addition of two professionals to our team. In October, Kevin Szeto joined the Golub Group as a Financial Planning Associate. Kevin moved to the Bay Area from San Diego, where he had served as an Advisor Client Support Specialist at eMoney, a financial planning software provider to our industry. We have long been a subscriber to eMoney, so we’re thrilled to have an insider perspective on the solution. Kevin graduated from UC San Diego in 2010, and completed all examination requirements to earn his Certified Financial Planner® credential. Kevin is fluent in Cantonese and enjoys snowboarding and Olympic weightlifting. In December, we were delighted to welcome Lana Xiao, CFP® to the team, in the role of Financial Advisor. Before joining Golub Group, Lana worked for Wells Fargo Private Bank, where she served clients with concentrated holdings in real estate, business owners and corporate executives. She previously served in a financial advisory role at First Republic Bank. Lana, who is bilingual with fluency in Mandarin Chinese, has a Master’s degree from the London School of Economics and a Bachelor’s degree from the University of San Francisco. She is also a Certified Financial Planner®. Please say hello to Kevin and Lana when you visit our offices.
As always, we have included with this commentary your quarterly performance figures, management fee invoice(s), and a copy of your portfolio allocation as of 12/31/19. You will receive statements from your custodian as well. We urge you to compare both statements to ensure accurate reporting. Please let us know if you do not receive a separate statement from your custodian.
We look forward to speaking with you, and if you would like to come in for a visit, please drop us a note or give us a call.
Golub Group
***The securities identified do not represent all of the securities purchased, sold or recommended for client accounts. The reader should not assume that an investment in the securities identified was or will be profitable.
GET THE NEXT SUMMITRY POST IN YOUR INBOX:
MORE INSIGHTS AND RESOURCES
Let's talk
Schedule a talk with one of our advisors to learn more about Summitry and how we can help you chart a path for your financial future.

Alex Katz
Chief Growth Officer


